Exercise / Test Summary
0 of 8 Questions completed
Questions:
Information
You have already completed the exercise / test before. Hence you can not start it again.
Exercise / Test is loading…
You must sign in or sign up to start the exercise / test.
You must first complete the following:
Results
Results
Your time:
Time has elapsed
You have reached 0 of 0 point(s), (0)
Earned Point(s): 0 of 0, (0)
0 Essay(s) Pending (Possible Point(s): 0)
Categories
- Not categorized 0%
-
 Arghhh! What happened ?
It looks like none of your answers were correct! You should replay the lesson before you continue.
-
Oh no! You can do better than that !
Review the lesson and then try taking this test again.
-
Not bad .
Perhaps you should look at the lesson again before you continue?
-
A good effort , but not great.
You should spend some time looking at the questions you answered incorrectly.
-
A very good effort !
Now you should review your answers to see which were correct and which were incorrect!
-
Well done! You got 100%!
That’s an excellent result !
- 1
- 2
- 3
- 4
- 5
- 6
- 7
- 8
- Current
- Review
- Answered
- Correct
- Incorrect
-
Question 1 of 8
1. Question
Part A
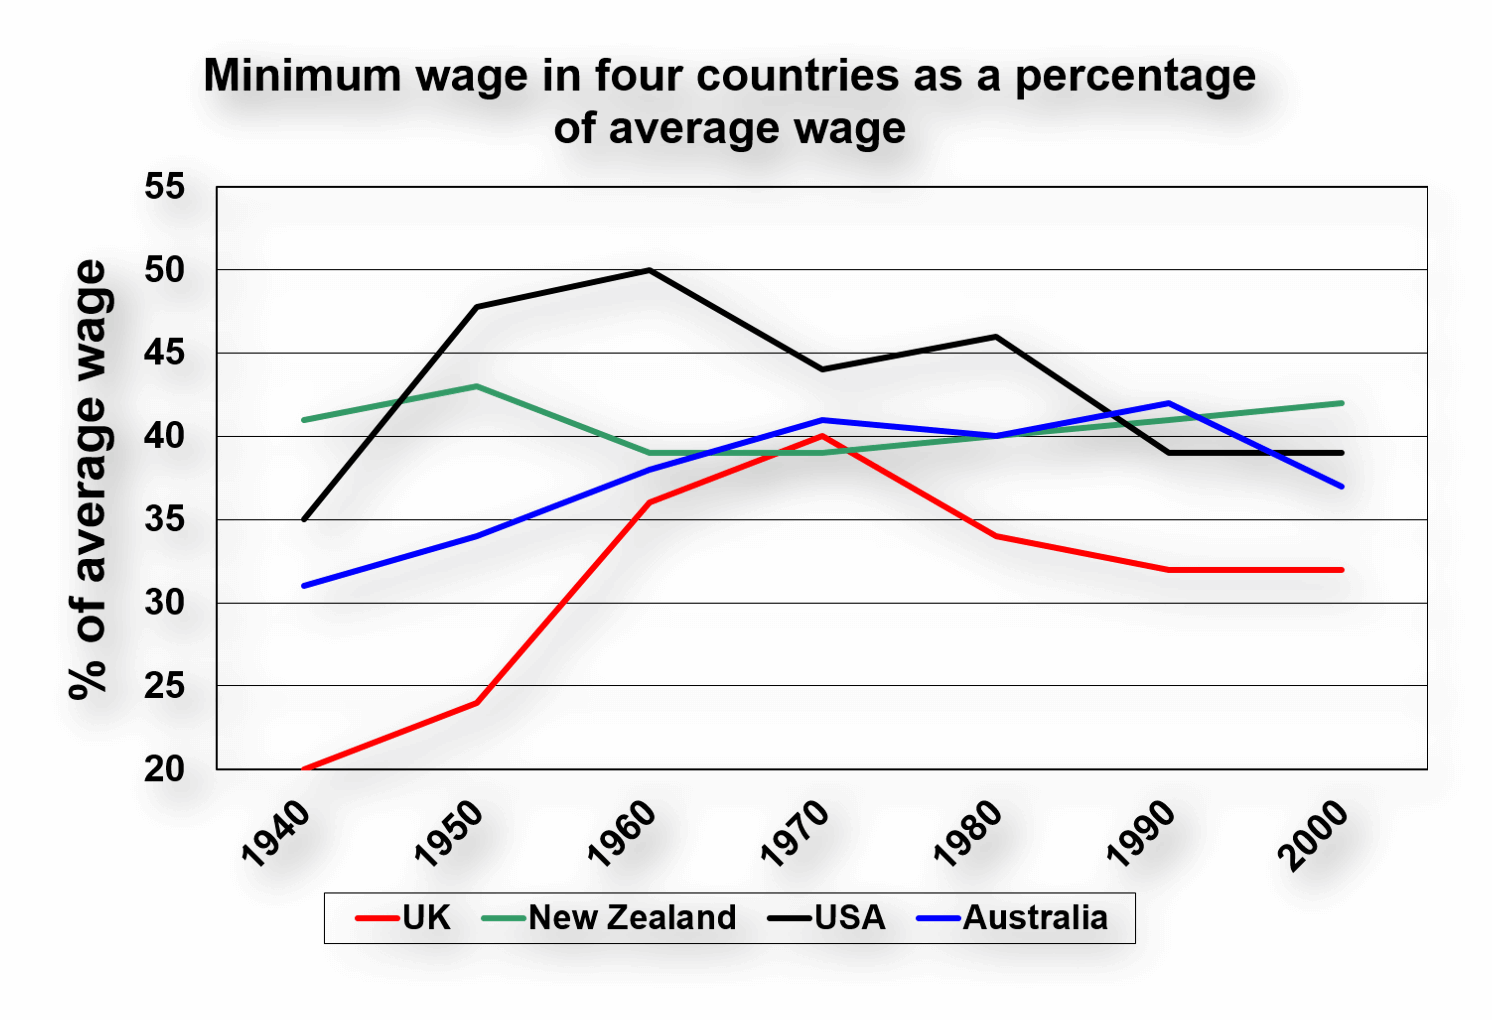
Look again at the line graph we used in the lesson. Read the body paragraphs and complete the text using a verb, noun, adverb or adjective to describe the trends. Use past simple verbs for this exercise. The first letter of the missing words have been given for you. Type your answers in to the spaces given.

-
The UK started at the lowest point, but increased m (adverb) up to 1950; followed by the most d (adjective) rise of all the countries from 1950 to 1960. In 1970 the UK p (verb) at about 40%; slightly higher than New Zealand. From 1970, the UK f (verb) to be the lowest of all the countries.
Both Australia and New Zealand c (verb) for the first ten years but New Zealand then d (verb) to under 40%. From 1960 onwards, New Zealand and Australia remained relatively close, with New Zealand finishing at approximately the same level at which it started.
For the first 20 years, the USA s (verb), reaching a p (noun) of approximately 50%. Despite a brief recovery in 1970, the USA fell to below 40% then s (verb) to show a similar trend to the UK.
CorrectIncorrect -
-
Question 2 of 8
2. Question
Part B
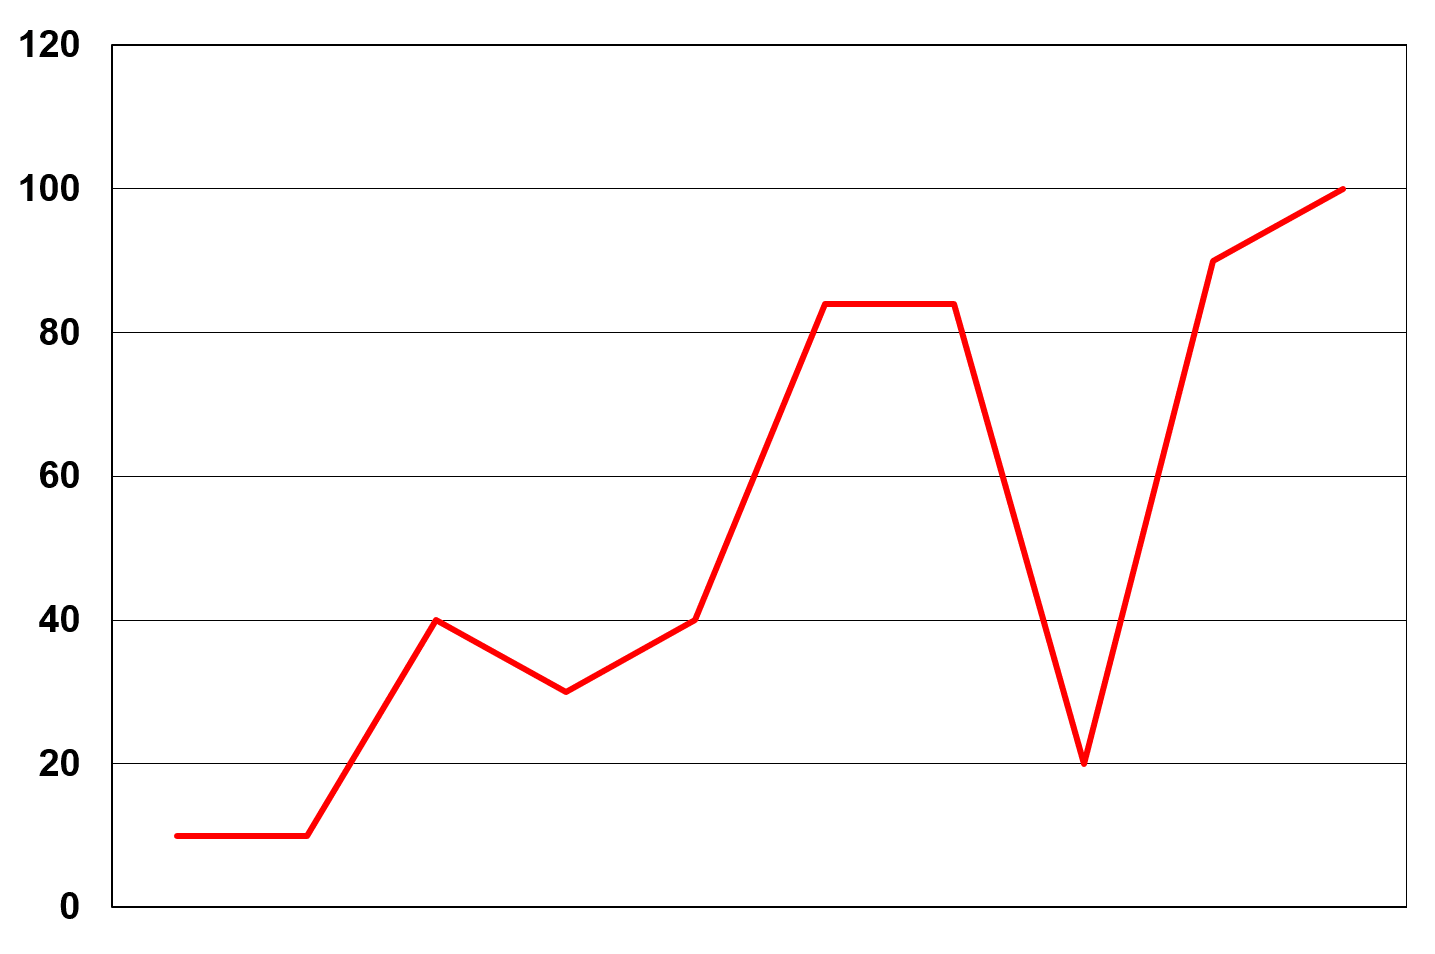
Which description matches the graph? Select the correct answer.
 CorrectIncorrect
 -
Question 3 of 8
3. Question
Which description matches the graph? Select the correct answer.
CorrectIncorrect -
Question 4 of 8
4. Question
Which description matches the graph? Select the correct answer.
CorrectIncorrect -
Question 5 of 8
5. Question
Which description matches the graph? Select the correct answer.
CorrectIncorrect -
Question 6 of 8
6. Question
Part C
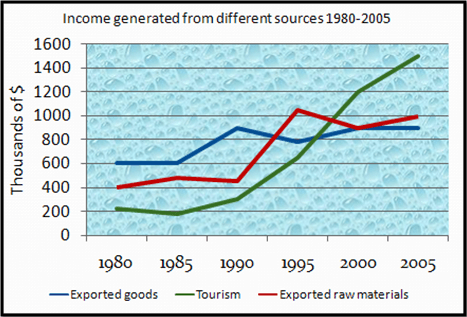
Is this a good plan for the Task 1 graph below? Select the correct answer.

Paragraph 1:
- From 1980 to 1985 tourism income declining, raw materials increasing, exported goods stable.
- From 1985 to 1990, exported goods = highest increase
- Tourism increases to above 1980 level
- Raw material income declines slightly
Paragraph 2:
- From 1985, tourism increased
- This increase slowed slightly in 2000.
- Reached about $1,500,000 by 2005
Paragraph 3:
- From 1990 to 2005, raw materials increased despite slight decline from 1995 to 2000.
- Exported goods remained about the same in 2005 as it was in 1990
CorrectIncorrect -
Question 7 of 8
7. Question
Is this a good plan for the Task 1 graph below? Select the correct answer.
Paragraph 1:
- From 1980 to 1985 tourism income declining, raw materials increasing, exported goods stable.
- Exported goods remain level
- Raw material income increases slightly
- Tourism falls
Paragraph 2
- From 1985 to 1990, tourism and exported goods increased (sharply for exported goods, moderately for tourism).
- Raw materials had a slight decline.
- Tourism rises above 1980 level
Paragraph 3
- From 1990 to 2005, raw materials increased despite slight decline from 1995 to 2000.
- Exported goods remained about the same in 2005 as it was in 1990
- Tourism continued to increase – rise became slightly less dramatic from 2000.
CorrectIncorrect -
Question 8 of 8
8. Question
Is this a good plan for the Task 1 graph below? Select the correct answer.
Paragraph 1:
- Exported goods showed no movement for the first five years.
- A slight increase was followed by a marginal decline until 1995
- From 1995 to 2000 increased again (not as sharply as 1985 to 1990).
- Finished by levelling off at a higher level than 1980 to 1985.
Paragraph 2:
- Tourism started by decreasing from 1980 to 1985.
- From 1985, tourism increased
- This increase slowed slightly in 2000.
- Reached about $1,500,000 by 2005
Paragraph 3:
- From 1980 to 1985, raw material increased (the only one of the three on the graph that increased)
- A slight decline followed by significant increase from 1990 to 1995.
- 1995 – decrease but improved slightly 2000 to 2005.
CorrectIncorrect